CHAPTER 09
Humid air: psychrometrics.
The air around us is a mixture of dry air and water vapor. How much vapor it holds, and how much it could hold at its temperature, decides whether a surface stays dry, whether a fountain cools a courtyard, and how much of a cooling load is spent on removing water. Psychrometrics, the physics of air–water mixtures, puts all of this on one chart.
Steady state, sea level (101.325 kPa), metric units; equations 9.1–9.9. Heat, temperature and specific heat are introduced in Chapter 07; this chapter adds the heat stored in water vapor. Every chart, lab and answer is computed from the same equations as the printed chart.
StartSZOKOLAY · ASHRAE · DIN
Quantities and symbols
The three-letter abbreviations of Szokolay, used on the lecture slides, name the properties of humid air. ASHRAE and German texts use other symbols for the same quantities; both are listed so that the chart in any textbook can be read.
| Symbol | Quantity | ASHRAE · German | Unit | Eq. |
|---|---|---|---|---|
| DBT · θ | Dry-bulb temperature: the air temperature | tdb · Lufttemperatur θ | °C | |
| WBT · θw | Wet-bulb temperature: read on a thermometer with a wet wick | twb · Feuchtkugeltemperatur | °C | 9.5 |
| DPT · θd | Dew-point temperature: the air saturates when cooled to it | tdp · Taupunkttemperatur | °C | 9.4 |
| pv · ps | Vapor pressure, saturation vapor pressure | pw, pws · Partialdruck pD, Sättigungsdruck pS | kPa | 9.1 |
| AH · SH | Absolute humidity (moisture content), saturation humidity | humidity ratio W · Wassergehalt x | g/kg dry air | 9.2 |
| RH | Relative humidity | φ · relative Luftfeuchte φ | % | 9.3 |
| h | Specific enthalpy: sensible plus latent heat per kg of dry air | h · Enthalpie h | kJ/kg | 9.6 |
| v · ρ | Specific volume per kg of dry air · density | v · spezifisches Volumen | m³/kg · kg/m³ | 9.7 |
| hfg | Latent heat of evaporation | hfg · Verdampfungsenthalpie r | kJ/kg | 9.6 |
Heat in a few lines
The lecture opens with the physics of heat of Chapter 07, summarized here.
- Energy · J, kWh
- 1 J = 1 W·s; 1 kWh = 1000 J/s × 3600 s = 3.6 MJ. US: 1 Btu = 1055 J = 0.293 Wh; Btu/h is a unit of power.
- Temperature · °C, K
- A point on the scale is written in °C, a difference in K: 40 °C − 10 °C = 30 K; 15 °C = 288.15 K.
- Specific heat · J/(kg·K)
- Heat to warm 1 kg by 1 K: metals 100–800, masonry 800–1200, air about 1006, water 4176 J/(kg·K). Sensible heat Q = m · c · Δθ. The lecture's kettle: 0.5 kg × 4176 × 80 K = 167 kJ, 208 s at 800 W.
- Latent heat · kJ/kg
- Heat absorbed at a change of state without a change of temperature, and released again in reverse: melting ice 335 kJ/kg; evaporating water 2501 kJ/kg at 0 °C, 2454 at 20 °C and 2257 at 100 °C (Szokolay §1.1.1). Evaporating 1 g of water takes as much heat as warming 2.4 kg of air by 1 K.
SATURATION · VAPOR PRESSURE · EQ. 9.1–9.3
Humid air and saturation
Air is a mixture of nitrogen and oxygen, but the atmosphere around us is humid air: it contains a varying amount of water vapor, rarely more than 3 % of its mass. At any temperature air can hold only a limited amount of vapor. Air that holds this maximum is saturated; add more, or cool it, and the excess condenses as dew, fog or rain.
Psychrometrics, with an r, is the physics of air–water mixtures. Psychometrics, without it, is psychological measurement (Szokolay).
Vapor pressure and absolute humidity
Each gas in a mixture contributes a partial pressure. The partial pressure of the water vapor, pv, measures how much vapor the air holds. Its upper limit, the saturation vapor pressure ps, depends on temperature alone and rises steeply: roughly doubling every 11 K.
For design the moisture is counted as a mass: grams of water per kilogram of dry air. This absolute humidity AH (humidity ratio, moisture content) does not change when the air is heated or cooled, as long as no water is added or removed. Counting per kilogram of dry air keeps the reference constant. Vapor pressure and AH are two parallel scales of the same quantity.
Example (Szokolay): pv = 2 kPa gives AH = 622 × 2 / (101.325 − 2) = 12.5 g/kg.
The saturation humidity SH is the AH of saturated air: the most water air at that temperature can carry.
| DBT | ps | SH | h at saturation |
|---|---|---|---|
| −10 °C | 0.287 kPa | 1.8 g/kg | −5.7 kJ/kg |
| 0 °C | 0.611 kPa | 3.8 g/kg | 9.4 kJ/kg |
| 10 °C | 1.226 kPa | 7.6 g/kg | 29.3 kJ/kg |
| 20 °C | 2.333 kPa | 14.7 g/kg | 57.3 kJ/kg |
| 25 °C | 3.160 kPa | 20.0 g/kg | 76.2 kJ/kg |
| 30 °C | 4.234 kPa | 27.1 g/kg | 99.5 kJ/kg |
| 40 °C | 7.367 kPa | 48.8 g/kg | 165.8 kJ/kg |
Relative humidity
Relative humidity compares the vapor present with the most the air could hold at the same temperature.
At 25 °C the saturation humidity is 20 g/kg; air holding 10 g/kg is at about half of it, 50 % RH. The same 10 g/kg at 15 °C (SH 10.6 g/kg) is at 94 % RH. RH therefore changes with temperature even when the amount of water does not:
- AH tells how much water the air carries. It stays constant when air is heated or cooled without condensation, and it sets the dew point.
- RH tells how close the air is to saturation, which is what evaporation from skin and wet surfaces, mold growth and the drying of materials respond to.
- Weather files and reports give DBT with RH or with DPT; the EPW files of Chapter 01 list all three.
PSYCHROMETER · EQ. 9.4–9.5
Dry bulb, wet bulb and dew point
Three temperatures describe humid air. They are equal only in saturated air; the drier the air, the further apart they are.
- Dry-bulb temperature DBT
- The air temperature, read on an ordinary thermometer shielded from radiation.
- Wet-bulb temperature WBT
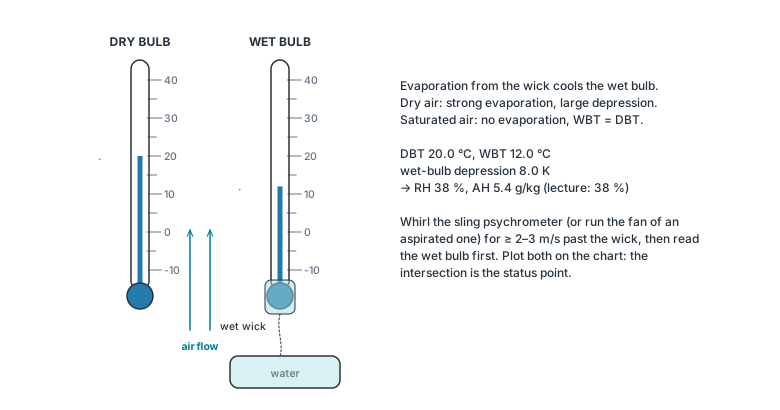
- Read on a thermometer whose bulb is wrapped in a wet wick and ventilated. Water evaporates from the wick and cools it until the heat drawn from the air balances the latent heat of evaporation. The drier the air, the stronger the evaporation and the larger the wet-bulb depression DBT − WBT.
- Dew-point temperature DPT
- The temperature to which the air must be cooled, at constant moisture content, to become saturated. A surface colder than the DPT collects condensation. Because it depends only on AH, the dew point is a direct measure of the moisture in the air; weather reports use it for that reason.
Measuring humidity
The sling (whirling) psychrometer is whirled by hand, the aspirated psychrometer (Assmann) has a fan; both need an air speed of 2–3 m/s past the wick and a clean wick wetted with distilled water. The two readings, plotted on the chart, fix the status point. Electronic sensors measure RH directly through the change of capacitance of a thin polymer film; they need calibration but log continuously, as in the stations of Chapter 01.
Example (Szokolay): DBT 29 °C and WBT 23 °C intersect on the 60 % RH curve at AH 15.2 g/kg. The dew point of this air is 20.5 °C.
On the chart the wet-bulb lines slope down to the right and meet the dry-bulb lines on the saturation curve, where WBT = DBT = DPT. Below 0 °C the wick freezes and the psychrometer reads the ice-bulb temperature; the chart in this chapter is drawn for saturation over liquid water at all temperatures.
ANY TWO PROPERTIES · EQ. 9.1–9.7
Reading the psychrometric chart
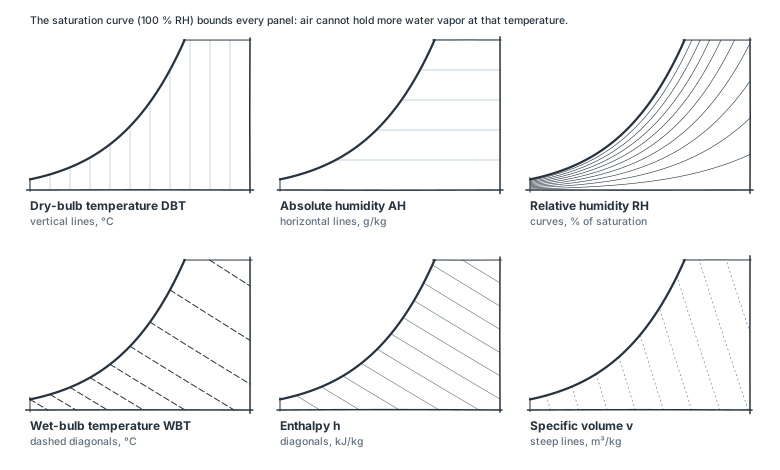
Willis Carrier drew the first psychrometric chart in 1904 to design air conditioning. It plots every possible state of humid air at one barometric pressure: dry-bulb temperature on the horizontal axis, absolute humidity on the vertical axis. Every point is a status point, one sample of air. The upper boundary is the saturation curve (100 % RH); points above it cannot exist as vapor.
- Dry-bulb temperature DBT · vertical lines
- Read on the horizontal axis. Moving right is heating, moving left is cooling.
- Absolute humidity AH · horizontal lines
- Read on the right-hand scale, often with a parallel scale of vapor pressure. Moving up adds water, moving down removes it.
- Relative humidity RH · curves
- Each curve divides the vertical distance from dry air to saturation in equal parts: the 50 % curve lies halfway up at every temperature.
- Wet-bulb temperature WBT · dashed diagonals
- Read where the line meets the saturation curve.
- Enthalpy h · diagonals
- Nearly parallel to the wet-bulb lines but not quite, so printed charts give enthalpy on scales outside the chart, read with a straight edge (Szokolay Fig. 1.8). Here the lines are drawn through and labeled at the saturation curve.
- Specific volume v · steep lines
- The volume of 1 kg of dry air with its vapor, about 0.84 m³/kg in a room; its inverse is the density.
Any two properties fix the state
Any two independent properties locate the status point; all the others are then read from the chart. Two properties are not independent when they lie on the same line family through the point, such as AH and DPT, or (almost) WBT and h.
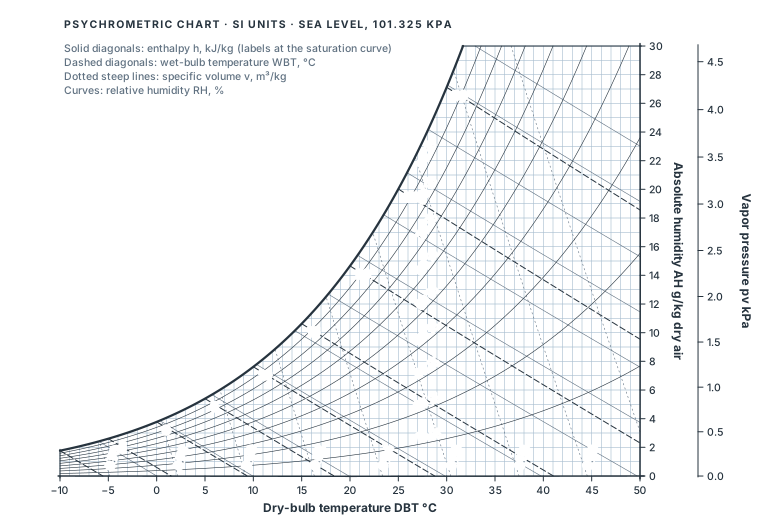
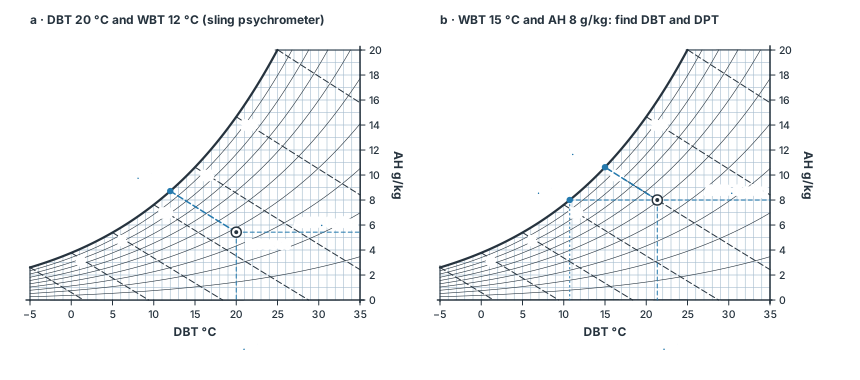
- DBT 20 °C and WBT 12 °C (from a sling psychrometer). Follow the 12 °C wet-bulb line down from the saturation curve to the 20 °C vertical. The point lies at 38 % RH and AH 5.4 g/kg; its dew point is 5.1 °C.
- WBT 15 °C and AH 8 g/kg. Follow the 15 °C wet-bulb line to the 8 g/kg horizontal: DBT 21.3 °C (the lecture reads 21.5 °C). Move left along 8 g/kg to the saturation curve: DPT 10.7 °C (lecture: 11 °C). The air is at 51 % RH.
- DBT 27 °C and RH 40 % (Lechner Fig. 4.5a). AH 8.9 g/kg (0.009 lb/lb), dew point 12.2 °C (54 °F).
EVERY PROPERTY FROM DBT AND RH
Sea level, 101.325 kPa. Saturation over liquid water, also below 0 °C. Chart readings and these values agree to the precision of a printed chart.
Pressure and altitude
A printed chart is valid for one barometric pressure. At Denver (1609 m, about 83.4 kPa) air at 20 °C and 50 % RH holds 8.8 g/kg instead of 7.2 g/kg at sea level, because the same vapor pressure is a larger share of a smaller total pressure (Eq. 9.2). Temperatures, RH and dew point are unchanged. Charts and software for high sites use the local pressure.
SENSIBLE · LATENT · EQ. 9.6–9.9
Sensible heat, latent heat and enthalpy
Humid air stores heat in two ways. Sensible heat raises its temperature and can be felt with a thermometer. Latent heat is the heat that was needed to evaporate the water it carries; it reappears when the vapor condenses. Enthalpy h is the sum, counted per kilogram of dry air from dry air at 0 °C.
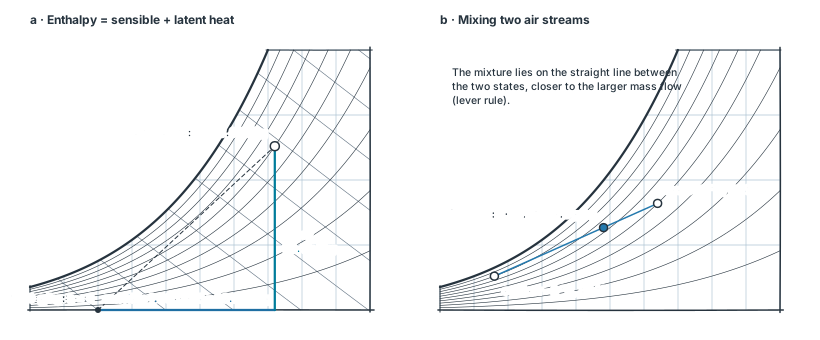
On the chart a status point's enthalpy can be read as two legs from the origin (0 °C, 0 g/kg): the horizontal leg is the sensible heat, the vertical leg the latent heat (Szokolay). Air at 26 °C and 60 % RH holds 58.3 kJ/kg: 26.2 kJ/kg sensible and 32.1 kJ/kg latent, more than half of its heat in its water.
Heating air
At constant moisture content only the sensible part changes. With c ≈ 1.006 + 1.86 · AH/1000 kJ/(kg·K) for the mixture:
Example (lecture frame 534): warming 1 kg of air from 5 °C to 20 °C takes q = m · c · Δθ = 1 × 1.0 × 15 = 15 kJ; with c = 1.014 kJ/(kg·K) for 4.3 g/kg, 15.2 kJ. The enthalpy rises from 15.9 to 31.1 kJ/kg.
A cubic meter of room air weighs about 1.2 kg (v ≈ 0.84 m³/kg), the value of ρ used for ventilation losses in Chapter 08. Warm and humid air is lighter than cool and dry air, which helps drive the stack effect.
Mixing two air streams
When two air streams mix without heat exchange with their surroundings, mass, water and energy are conserved. The mixture lies on the straight line joining the two status points, divided in inverse proportion to the masses (lever rule).
Example: 2 kg of room air at 22 °C, 50 % mixed with 1 kg of outdoor air at −2 °C, 80 % gives 14.1 °C and 6.3 g/kg. A mixing line that crosses the saturation curve produces fog: breath on a cold day, or the plume of a cooling tower.
HEATING · COOLING · EVAPORATION · EQ. 9.8
Psychrometric processes
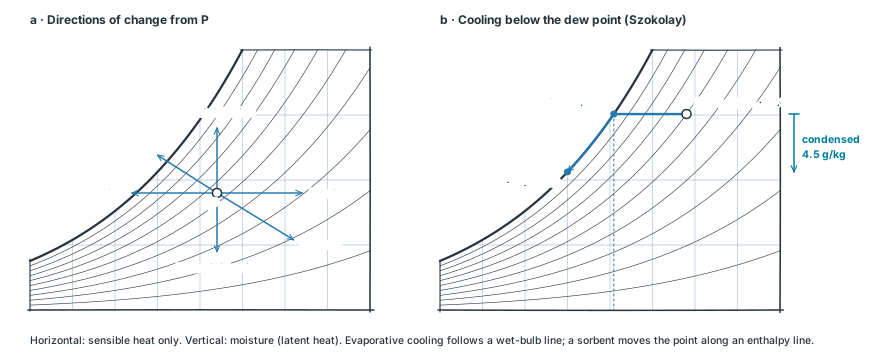
Every change of the air in a building, a climate or a machine is a path on the chart. Horizontal moves change sensible heat only, vertical moves change the moisture and the latent heat. The heat involved is the change in enthalpy.
Heating and cooling
Adding or removing heat without changing the moisture content moves the status point horizontally: right for heating, left for cooling. AH stays the same, RH does not.
Example (lecture frame 534): outdoor air at 5 °C and 80 % RH heated to 20 °C holds the same 4.3 g/kg, but its RH falls to 30 %.
This is why heated rooms are dry in winter and why the lecture's humidifiers sit on radiators. Ithaca air at −5 °C and 80 % RH, warmed to 21 °C, is at 14 % RH: dry enough for static shocks, cracked wood and dry eyes. Cooling works the other way: the RH rises until the air is saturated.
Cooling below the dew point: dehumidification
If cooling continues past the dew point, the status point follows the saturation curve down to the left and the excess water condenses. The vertical drop is the water removed.
Example (lecture frame 539): air at 10 °C and 80 % cooled to 3 °C is saturated and has lost 1.4 g of water per kg (the lecture reads 1.5 g/kg). Szokolay: 29 °C, 60 % (15.1 g/kg) cooled to 15 °C keeps 10.6 g/kg; 4.5 g/kg condense (Szokolay reads 15.2 − 10.5 = 4.7 g/kg from the chart).
Dew on grass at dawn is this process: the ground radiates to the clear night sky, cools below the dew point of the air and collects water. The Warka Water tower ↗ harvests fog and dew for drinking water with a mesh that cools at night and that fog droplets collide with. A mechanical air conditioner does the same on its cooling coil, then reheats the cold, saturated air, or mixes it with room air, to a comfortable supply temperature.
Example: humid air at 31 °C and 65 % (18.4 g/kg) cooled to 13 °C on a coil loses 9.1 g/kg of water and 41.7 kJ/kg of heat; 23.0 kJ/kg of that, more than half, is latent. Reheated to 20 °C it is at 64 % RH.
Evaporative cooling: adiabatic humidification
When water evaporates into air without heat being supplied or removed (adiabatic), the latent heat of evaporation is taken from the air itself. The status point moves up and to the left along its wet-bulb line: the air gets cooler and more humid, while its enthalpy stays almost the same (it rises only by the small enthalpy of the liquid water). The air cannot be cooled below its wet-bulb temperature.
Example (lecture frame 542): air at 30 °C and 10 % RH is cooled to 20 °C by evaporating 4.1 g of water per kg; it leaves at 46 % RH (lecture: 45 %).
Evaporative cooling works where the wet-bulb depression is large: hot and dry climates. Phoenix air on a July afternoon (41 °C, 12 %) has a wet bulb of 19.9 °C; cooled to 25 °C it is at 63 % RH. In humid Miami (31 °C, 65 %, WBT 25.6 °C) the same pad cools by a few kelvin only and makes the air muggier. The malqaf (wind-catcher) of Egyptian and Gulf architecture draws wind down a shaft past wet surfaces or porous water jars; fountains, pools and planted courtyards of Islamic gardens cool the air in the same way. Direct evaporative coolers (swamp coolers) and the wetted pads of greenhouses are the mechanical versions.
Adiabatic dehumidification: sorbents
If the air passes through a sorbent such as silica gel, a desiccant wheel or a glycol spray, some of its water is adsorbed. The released latent heat of condensation becomes sensible heat: the status point moves down and to the right along a line of constant enthalpy. The air is drier but warmer and must be cooled afterwards, by evaporative or mechanical cooling. Desiccant systems are regenerated with low-grade heat, for example from solar collectors.
Example: air at 25 °C and 60 % (11.8 g/kg) dried to 7.9 g/kg leaves at 35 °C and 23 % RH.
PER KG OF DRY AIR, AND FOR THE AIR FLOW
CONDENSATION · MOLD · COMFORT · VENTILATION
Humidity in buildings
Condensation and mold
Condensation occurs wherever moist air meets a surface colder than its dew point (Szokolay §1.5.4). Room air at 20 °C and 50 % RH has a dew point of 9.3 °C: the bathroom mirror, single glazing and the edge of a window frame in winter, or a cold-water pipe in summer, collect water. Mold does not need liquid water; it grows where the air next to a surface stays above about 80 % RH, which for this room air happens below 12.6 °C (Chapter 07).
The inside surface temperature follows from the U-value of the element: θsi = θi − U · Rsi · (θi − θe) (Eq. 7.9). At −5 °C outside, single glazing (U 5.8) is at about 1 °C and runs with water; old double glazing (U 2.8) at 11 °C stays dry but is at mold risk at its edges; triple glazing (U 0.7) at 18 °C and an insulated wall (U 0.25) at 19 °C are safe.
INSIDE SURFACE OF A WINDOW OR WALL
Steady state, Rsi = 0.13 m²K/W, center of the element. Frames, corners and thermal bridges are colder; DIN 4108-2 checks mold with Rsi = 0.25 m²K/W.
The causes of condensation are always the same three (Szokolay):
- Moisture input. A person releases about 50 g of water vapor per hour, a shower about 200 g, cooking and drying laundry indoors far more. A household of four releases of the order of 10 kg of water a day.
- Too little ventilation. The vapor stays indoors. With 150 kg/h of fresh air (0.5 h⁻¹ in a 250 m³ house), 200 g/h of vapor raise the indoor AH by 1.3 g/kg above the outdoor value.
- Cold surfaces. Poor insulation, thermal bridges at corners, junctions and window frames, and unheated rooms that are reached by warm, moist air.
Interstitial condensation occurs inside a construction, where vapor diffusing outward reaches a layer colder than its dew point. Wet insulation insulates less, the layer gets colder still, and timber rots. A vapor retarder on the warm side and vapor-open layers outside prevent it (the Glaser method of DIN 4108-3 and ISO 13788, and hygrothermal simulation, check it). In a hall with a large vapor load a single-glazed condenser window with a drained trough can serve as a deliberate cold surface that collects water before anything else does.
Comfort and humidity
At moderate temperatures humidity matters less for comfort than temperature: RH between about 30 and 65 % has little effect (Szokolay §1.2.2). Outside that range:
- Too dry (below about 20 % RH): dry eyes, mouth and skin, more respiratory infections, static electricity and shrinking, cracking wood (Lechner §4.4). Heated rooms in a cold winter reach this unless moisture is added.
- Too humid (above about 60 % RH in summer, 80 % in winter): sweat no longer evaporates freely, the skin feels sticky, and mold and dust mites thrive.
Lechner's comfort zone on the chart spans about 20–25.5 °C (68–78 °F) and 20–60 % RH in summer, up to 80 % in winter, for still air and surfaces near air temperature (toggle it in the status-point lab of section 03). Air movement, radiant temperature, activity and clothing move the zone, and the building bioclimatic chart of Givoni and Milne adds the design strategies for each region of the chart: shading, thermal mass, ventilation, evaporative cooling, dehumidification. Both belong to thermal comfort.
Latent loads of ventilation
Fresh air brings its moisture with it. In summer in a humid climate the latent load of ventilation air often exceeds its sensible load: removing water takes more cooling energy than lowering the temperature.
Example: 100 m³/h of outdoor air at 31 °C and 65 % (18.4 g/kg) supplied to a room held at 24 °C and 50 % (9.3 g/kg): sensible load 1.2 × 100/3600 × 1.006 × 7 = 235 W; latent load 1.2 × 100/3600 × 9.1/1000 × 2 450 000 = 747 W. Three-quarters of the load is water.
Energy-recovery ventilators exchange moisture as well as heat between exhaust and supply air; dedicated outdoor-air systems dry the fresh air separately so that the room units handle sensible heat only. In winter the opposite holds: ventilation air is too dry, and the heat balance of Chapter 08 counts only its sensible heat.
9 QUESTIONS · CALCULATION AND CONCEPT
Self-test
"New values" generates a new variant of a calculation. Each answer shows a worked solution. Check your chart readings against the calculated answers: a careful reading is within about 0.5 °C, 0.5 g/kg and 2 % RH.
EDITABLE VECTOR FILES
Figure files
Editable SVG files of every figure. The psychrometric chart prints on A4 or letter paper. Interactive charts save their current state with "Save SVG".
- psychrometer.svg · Fig. 1 · Sling psychrometer: dry-bulb and wet-bulb thermometers. With DBT 20 °C and WBT 12 °C the air is at 38 % RH (lecture frames 526 and 529).
- chart-anatomy.svg · Fig. 2 · Anatomy of the psychrometric chart: the six families of lines, each bounded by the saturation curve (lecture frames 525–527; Szokolay Figs. 1.4–1.10).
- psychrometric-chart.svg · Fig. 3 · Psychrometric chart, SI units, sea level (101.325 kPa), computed from Eq. 9.1–9.7. The editable SVG prints on A4 or letter paper for homework.
- chart-reading.svg · Fig. 4 · Reading the chart from two known properties: the two examples of the lecture (frames 529–531).
- enthalpy-mixing.svg · Fig. 5 · Sensible and latent heat in the enthalpy of humid air (a), and adiabatic mixing of two air streams (b).
- chart-processes.svg · Fig. 6 · Psychrometric processes: directions of change from a status point P (a), and cooling below the dew point (b) (lecture frames 533–543; Szokolay Figs. 1.11–1.14).
SOURCES
Sources and model notes
- S. V. Szokolay, Introduction to Architectural Science: The Basis of Sustainable Design, 3rd ed., Routledge, 2014. §1.1.1 (heat, specific and latent heat), §1.1.3 (humid air: psychrometry, Figs. 1.4–1.14, Eq. 1.6–1.7), §1.2.2 (humidity and comfort), §1.5.4 (condensation and moisture control).Terms DBT, WBT, DPT, AH, SH, RH; the worked examples of sections 01–05 and the causes of condensation.
- N. Lechner, Heating, Cooling, Lighting: Sustainable Design Methods for Architects, 4th ed., Wiley, 2015. §4.4–4.9 (thermal conditions, the psychrometric chart, dew point and wet bulb, heat content of air, comfort zone), §4.12 (building bioclimatic chart).Comfort ranges of RH and temperature, sensible and latent heat on the chart, adiabatic change.
- ASHRAE, Handbook — Fundamentals, SI edition, 2017, Ch. 1 (psychrometrics).Humidity ratio, enthalpy, specific volume and the psychrometer equation used here (Eq. 9.2, 9.5–9.7).
- D. Sonntag, "Important new values of the physical constants of 1986, vapour pressure formulations based on the ITS-90, and psychrometer formulae", Zeitschrift für Meteorologie 40 (1990) 340–344; WMO, Guide to Instruments and Methods of Observation, Annex 4.B.Magnus constants 17.62 and 243.12 °C (Eq. 9.1, 9.4), shared with the dew point of Chapter 07.
- H.-M. Fischer, R. Jenisch, M. Stohrer et al., Lehrbuch der Bauphysik, 6th ed., Vieweg+Teubner, 2008. Chapters on moisture (Feuchte); DIN 4108-2 and -3, EN ISO 13788.Mold criterion (80 % RH at the surface), Glaser method, German symbols.
- W. H. Carrier, "Rational psychrometric formulae", Transactions of the ASME 33 (1911).The first psychrometric chart (1904) and the basis of air conditioning.
- B. Givoni, "Comfort, climate analysis and building design guidelines", Energy and Buildings 18 (1992) 11–23; M. Milne and B. Givoni, "Architectural design based on climate", in D. Watson (ed.), Energy Conservation through Building Design, McGraw-Hill, 1979.The building bioclimatic chart.
- Warka Water, Arturo Vittori and Architecture and Vision ↗Fog and dew harvesting; shortlisted for the World Design Impact Prize 2015–16 (lecture frame 538).
- T. Dogan, ES1 lecture "Physics of heat, psychrometrics", Cornell AAP, 2026, frames 516–543.Order of topics and the chart examples of sections 03 and 05.
Model assumptions and precision
All values are for a barometric pressure of 101.325 kPa (sea level) and treat dry air and water vapor as ideal gases. Saturation is over liquid water at all temperatures, also below 0 °C; over ice the saturation pressure is up to 10 % lower at −10 °C. The Magnus formula agrees with the ASHRAE (Hyland–Wexler) values within 0.4 % from −10 to 50 °C. The wet-bulb temperature is the thermodynamic wet bulb of the psychrometer equation; a sling psychrometer reads it within a few tenths of a kelvin when ventilated at 2–3 m/s. Evaporative cooling follows the wet-bulb line; the sorbent process follows the enthalpy line. Specific heats 1.006 and 1.86 kJ/(kg·K) and hfg = 2501 kJ/kg at 0 °C are taken as constant. The surface lab uses steady-state heat transfer through the center of an element with Rsi = 0.13 m²K/W. Chart readings in the lecture and the textbooks differ from the computed values by up to 0.3 K, 0.2 g/kg and 2 % RH: the precision of reading a printed chart.