CHAPTER 04
Sun paths and shading.
Graphic methods that turn the sun position into design checks: which surfaces receive direct sun and when, how far obstructions and shading devices screen it, and where shadows fall on a site.
This chapter uses ALT and AZI from Chapter 02 (Eq. 7–8); equation numbers continue from Chapter 03. Symbols are listed in the Chapter 02 nomenclature.
StartPROJECTIONS · EQ. 14
Sun-path diagrams
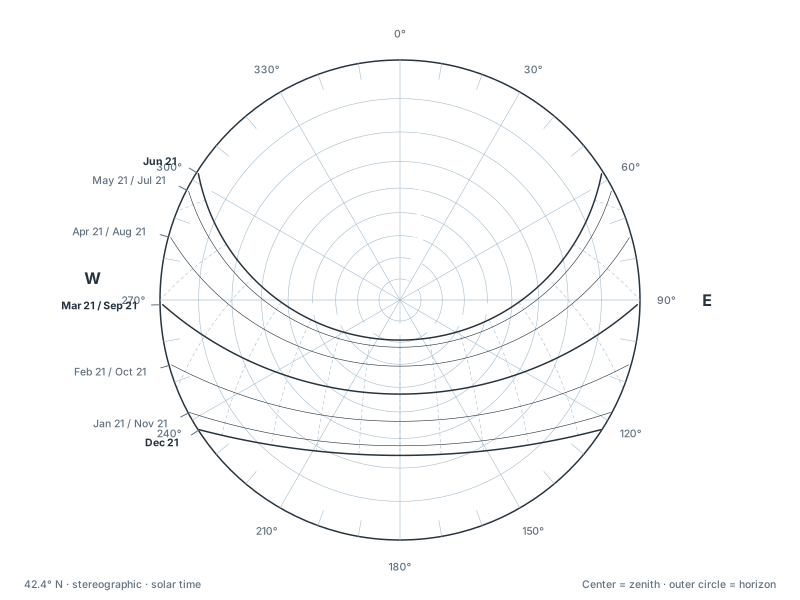
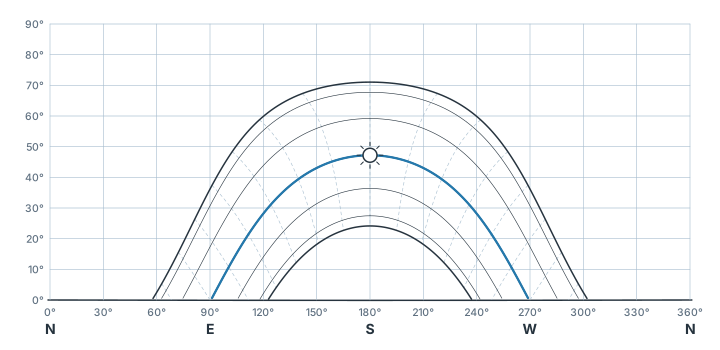
A sun-path diagram projects the sky hemisphere onto a plane and draws the sun's daily paths for a given latitude. Date lines (usually the 21st of each month) cross hour lines (solar time). Any point gives ALT and AZI.
- Cylindrical (vertical) projection
- x = AZI, y = ALT. Easy to overlay on a panoramic photo. Strongly distorted near the zenith.
- Stereographic projection
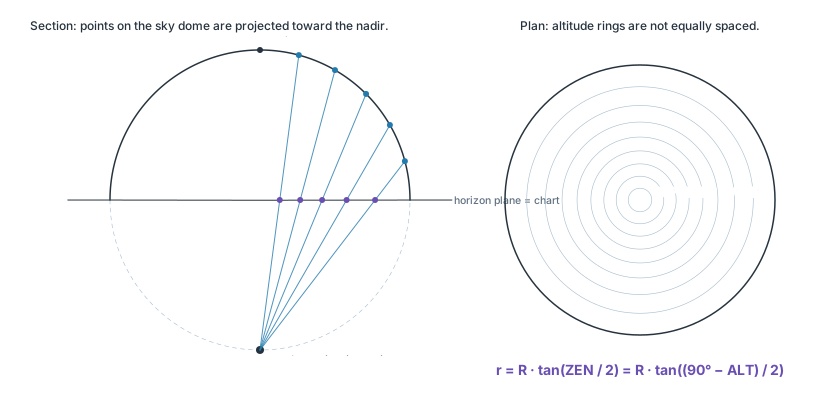
- Each point of the hemisphere is projected toward the nadir onto the horizon plane. Center = zenith, outer circle = horizon. The altitude rings are not equally spaced.
READING THE CHART
- Find the date line (21st of the month; dates symmetric about Jun 21 share a line).
- Find its intersection with the hour line.
- Read ALT from the rings, AZI from the perimeter.
Latitude
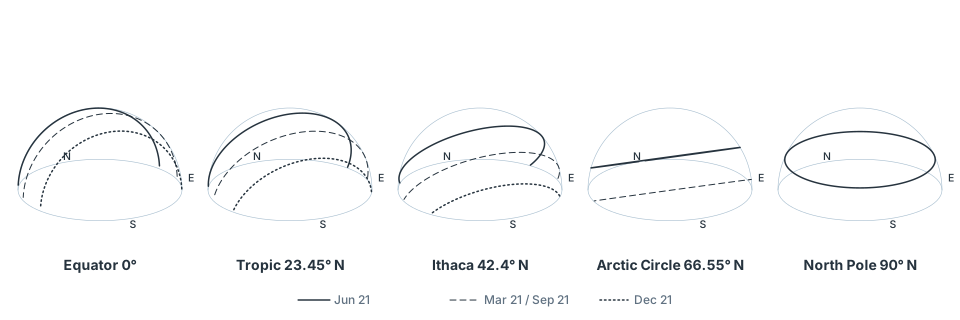
At the equator the paths are symmetric about the zenith and the equinox path passes through it. With increasing latitude the paths tilt toward the equator-facing horizon. At the poles they become circles parallel to the horizon.
OBSTRUCTIONS · EQ. 15
Shading masks
A shading mask is the outline of the obstructions around one point, projected onto the same chart as the sun paths. Where a sun path runs inside the mask, the point receives no direct sun.
For a vertical edge of height H above the point, at horizontal distance D, the obstruction angle is the altitude of its top:
OBSTRUCTION · EQ. 15
DIRECT SUN AT THE POINT
- A mask is valid for one point. Masks for points on the same facade differ; for a surface they must be combined.
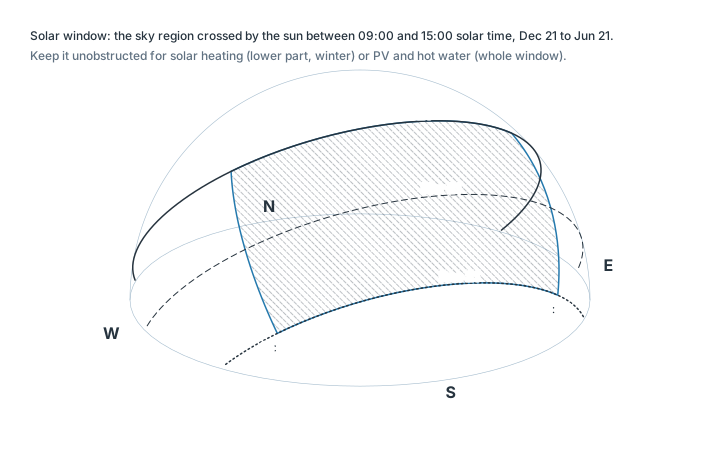
- The solar window is the part of the sky crossed by the sun between 09:00 and 15:00, from Dec 21 to Jun 21. Obstructions in its lower part remove winter sun; in the whole window, sun for PV and solar hot water.
HSA · VSA · EQ. 16–21
Profile angle and shading devices
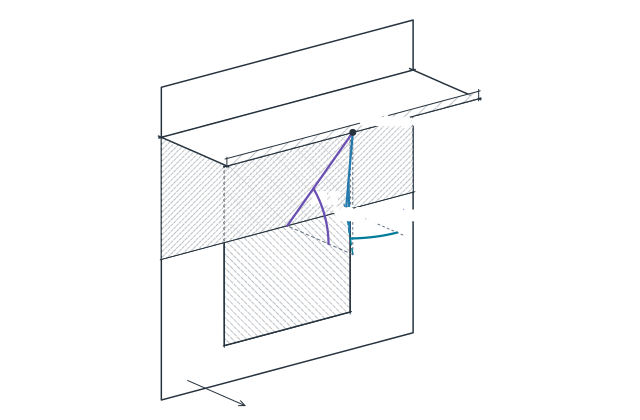
Shading devices are sized in two drawings: a section perpendicular to the facade and a plan. Neither shows the true altitude unless the sun is directly in front of the facade. The sun angle must first be projected into each drawing.
- HSA · horizontal shadow angle
- Angle in plan between the facade normal and the sun's azimuth. Governs vertical devices (fins).
- VSA · vertical shadow angle, profile angle
- Angle in the section perpendicular to the facade between the horizontal and the projected sun ray. Governs horizontal devices (overhangs, louvres). VSA = ALT only when HSA = 0.
- INC · angle of incidence
- Angle between the sun ray and the facade normal. Sets the beam irradiance on the facade (Chapter 05, Eq. 27).
EQ. 16–19 WITH THESE INPUTS
Window H = 1.5 m, w = 1.2 m; overhang G = 0.3 m above the head. Overhang and fins are assumed continuous beyond the window.
Sizing
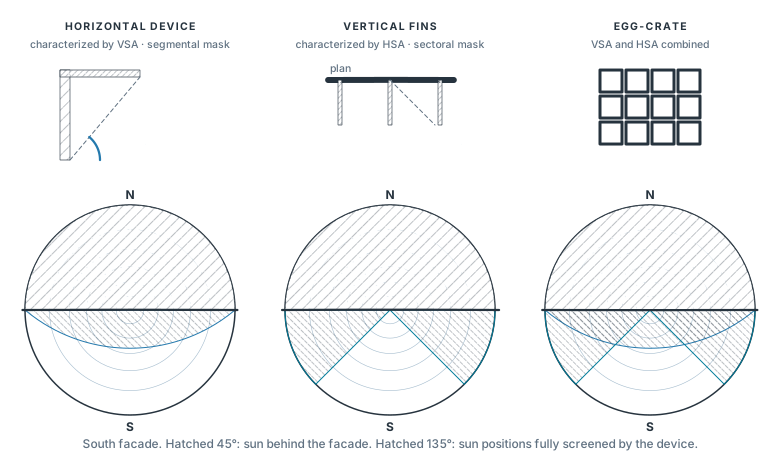
A device is described by its cut-off angles: VSAdevice = arctan((H + G)/D) and HSAdevice = arctan(w/d). Plotted on the sun-path diagram for the facade orientation, they form the device's shading mask: segmental for horizontal devices, sectoral for vertical fins, combined for egg-crates. All sun positions inside the mask are fully screened.
PROCEDURE
- Define the overheated and underheated periods from climate data and building type.
- Draw the facade line through the chart center. Sun behind it (gray) never reaches the facade.
- Choose VSA and HSA so the mask covers the overheated period.
- Check that the mask leaves the underheated period open.
- Prevent outflanking: extend the overhang at least H/2 beyond each side, or add fins.
- VSAdevice
- —
- HSAdevice
- —
- Equinox cut-off (Eq. 21)
- —
Do not size devices on Jun 21 and Dec 21 alone. Jun 21 has the highest sun and is the easiest date to shade; the hottest weeks are later (July–August). Test the last day of the overheated period, when full shade is still required, and the last day of the underheated period, when full sun is still wanted. For east and west facades, test early morning and late afternoon: ALT and HSA are both small, VSA is small, and horizontal overhangs are ineffective.
SHADOW LENGTH · EQ. 22
Shadows and solar access
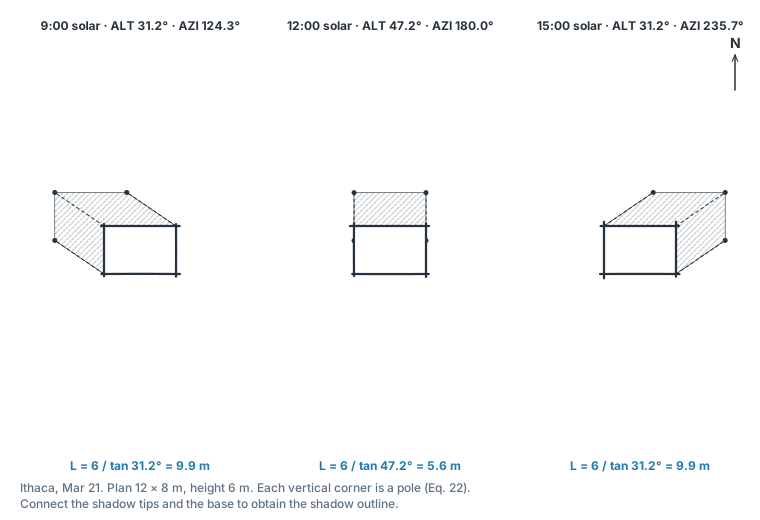
A building is a set of vertical edges ("poles"). The shadow of each edge is drawn in plan from its length and direction; the outline joining the shadow tips and the base is the building's shadow on level ground.
Overshadowing study
Overlaying the shadows of several hours shows which areas are shaded and for how long.
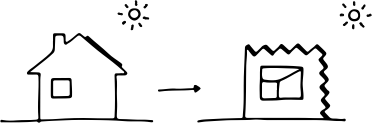
KEEP THE FOOTPRINT. CHANGE THE FORM.
West wing 3 m; neighbors to the north. Exercise rule (not a code requirement): no ground shadow on a neighbor footprint at 10:00–14:00.
Lowering the east wing from 6 m to 3 m halves its shadow length (Eq. 22). At 12:00 on Mar 21 in Ithaca, ALT = 47.2°, so a 6 m wing casts 5.6 m and a 3 m wing 2.8 m.
7 QUESTIONS · CALCULATION AND CONCEPT
Self-test
"New values" generates a new variant of a calculation. Each answer shows a worked solution.
EDITABLE VECTOR FILES
Figure files
Editable SVG files of every figure. Interactive drawings save their current state with "Save SVG".
- stereographic-construction.svg · Fig. 1 · Stereographic projection
- sunpath-ithaca-stereographic.svg · interactive drawing, reference state · Sun-path diagram, Ithaca
- sunpath-ithaca-cylindrical.svg · interactive drawing, reference state · Cylindrical sun-path diagram, Ithaca
- latitudes.svg · Fig. 2 · Sun paths at different latitudes
- solar-window.svg · Fig. 3 · Solar window, Ithaca
- profile-angle.svg · interactive drawing, reference state · Profile angle construction
- device-types.svg · Fig. 4 · Device types and shading masks
- shadow-construction.svg · Fig. 5 · Shadow construction
SOURCES
Sources and model notes
- S. V. Szokolay, Introduction to Architectural Science, 3rd ed., Routledge, 2014. Section 1.4.1; Method sheets M.1.1 (solar geometry), M.1.2 (stereographic charts, shadow-angle protractor).Eq. 16–18, 21; device masks.
- N. Lechner, Heating, Cooling, Lighting, 4th ed., Wiley, 2015. 9.5–9.9 (shading periods, overhangs).Solar window, sunbeam drawing, test dates.
Model assumptions and precision
Sun positions use Eq. 3, 4, 6, 7 and 8 of Chapter 02, with the same accuracy and assumptions.
Masks and shadows assume parallel rays, opaque obstructions, level ground and a clear sky. The window model assumes an overhang and fins that continue beyond the window. Direct-sun hours are sampled every 5 minutes. These are geometric screening tools; daylight, glare, solar gains and comfort need climate data (Chapter 01), radiation on surfaces (Chapter 05) and simulation.
Continue to Chapter 05: Solar radiation on surfaces ↗